

The primary goal of a healthcare marketer is to attract and retain patients. Behind every hospital or urgent care facility serving a particular community, every “body contouring” brand providing elective plastic surgeries, there’s a marketing function hard at work. And while the types of medical practices vary, there is one undercurrent running throughout them all: data.
Why “The Devil is in the Metrics”
Data can be a bit of a pandora’s box, especially in the world of healthcare marketing, so we find it helpful to bucket these metrics into two categories: marketing campaigns and financial performance.
Marketing campaign metrics are typically used to measure “operational” marketing tactics like search engine optimization (SEO) and paid advertising (display ads, PPC, etc.). Most of these metrics boil down to what you want a patient or prospective patient to do (call, click, book) versus how well your campaigns are supporting the desired outcome.
Financial performance metrics typically measure the health of marketing efforts at a high level and against organizational financial objectives. This includes the cost of acquiring new patients, keeping patients, and the lifetime value of a patient to a healthcare practice.
The latter can tell us, for example, that as good as we might be at acquiring new patients, the process is incredibly costly, which is in turn driving down the overall value of a patient over the lifetime of their patronage. This information can inform micro-level marketing tactics, such as where to increase or dial back ad spend.
Taken together, these metrics can help organizational stakeholders—from the executive level on down—answer a simple question: is the investment worth it? If not, why? It might not just be that a campaign isn’t “working,” or working optimally, but that it’s not creating a good patient experience. These insights are what make data so important to healthcare marketing.
8 Marketing Metrics to Monitor and Optimize
Based on our own extensive experience in the healthcare marketing field, here are eight core metrics to focus on as a healthcare marketer. Think of this as the data scaffolding upon which a truly thriving healthcare marketing program ought to be built.
1. Patient Acquisition Cost (PAC)
Patient acquisition cost (PAC) is foundational, a metric that helps you understand the overall success of your healthcare marketing strategy while contextualizing some of your other important metrics. Essentially, PAC boils down to how much it costs to acquire a new patient through your various marketing channels and within a specific period. To calculate the total cost of acquiring a patient, you ought to consider a comprehensive list of expenses, including:
- Digital and print advertising
- Content marketing
- SEO
- Event and conference management
- Media relations and PR
- Creative services
- Website development and maintenance
- Personnel
- All marketing technology vendor contracts
Here’s how PAC is calculated:

When healthcare brands come to us with suboptimal, broken, or depleted marketing programs, PAC often provides some “a-ha” moments. It can remove the blinders for organizations hell-bent on a particular lead acquisition strategy, often revealing the need to begin considering viable alternative strategies that might continue driving new patients without inflating patient acquisition cost. When compared to patient lifetime value or patient retention rate, PAC can reveal for instance that certain organizations, while acquiring patients at a steady click, are failing to keep them coming back.
2. Patient Lifetime Value (PLTV)
Getting patients in the door is one thing. Getting them to stay engaged and spend money, in the form of additional appointments, procedures, and purchases is something else. That’s the essence of patient lifetime value (PLTV), which calculates the average amount of money your customers will spend during their relationship with your practice.
To calculate PLTV, you need to first determine the average patient value by identifying the average purchase value and then multiply that number by the average purchase frequency rate, as follows:
 APV can be simple for certain practices in which patients follow a standard schedule of appointments and procedures (prenatal and postpartum care, for example). Dentists, for example, can reasonably expect to bill dental cleanings for each of their patients twice a year. For others, this calculation isn’t as straightforward, which is precisely where predictive analytics and data modeling can help identify purchasing patterns and inform more accurate forecasting.
With APV in hand, you can determine the average patient’s lifespan and multiply that by the average patient value, which will give you the lifetime value of the patient, as follows:

What PLTV can reveal, among other insights, are opportunities to create additional and ongoing value for patients with timely upsells or crossells that enrich the patient experience. Staying with the dental practice example, patients who’ve just attended a cleaning might benefit (and convert) from a follow-up email campaign touting the value of an electric toothbrush (with a purchase option as its CTA).
3. Ratio of Patient Lifetime Value to Patient Acquisition Cost
Here’s where healthcare marketers can look into the crystal ball a bit. The ratio of PLTV to PAC can be used as an indicator of sustainable growth, especially as it relates to marketing spend. Here’s how it’s calculated:
 Naturally, you never want to be “upside-down” in terms of this ratio—you don’t want it to cost more to acquire a patient than the value that patient provides your organization over their lifetime. Suboptimal PLTV:PAC ratio can indicate, at a high level, that the spend and performance of the current sales and marketing strategy isn’t efficient, sustainable, or profitable. Consider this metric for your executive dashboard.
4. Patient Retention Rate (PRR)
Here’s another healthcare marketing metric that can provide a “come to Jesus” moment for some of our clients. Again, acquiring new patients is only half the battle. How well you’re able to retain those patients, measured by your patient retention rate (PRR) is a strong indicator of patient satisfaction, the quality of the experience, and how marketing strategy might be optimized to improve this metric. Here’s how it’s calculated:

… where:
- PE = Number of patients at the end of a period
- PN = Number of new patients acquired during that period
- PS = Number of patients at the start of that period
In measuring PRR, think about the time periods relevant to your specific practice. An orthopedics clinic, for example, might only treat patients for a short time following an injury, while a dentist might see patients routinely, year after year. Adjust your PRR calculations according to your business model so you get more value out of the metric.
5. Patient Satisfaction
With something as personal as healthcare, experience matters. Measuring patient satisfaction is a good way to not only take the pulse of overall patient sentiment but to reveal gaps or points of friction in the patient journey. Typically, patient satisfaction surveys are delivered over the phone, or through traditional customer satisfaction (CSAT) surveys sent by email or text—both after an appointment, call, surgery, and so on. These scores can be aggregated into a composite score out of five, then compare against healthcare industry averages.
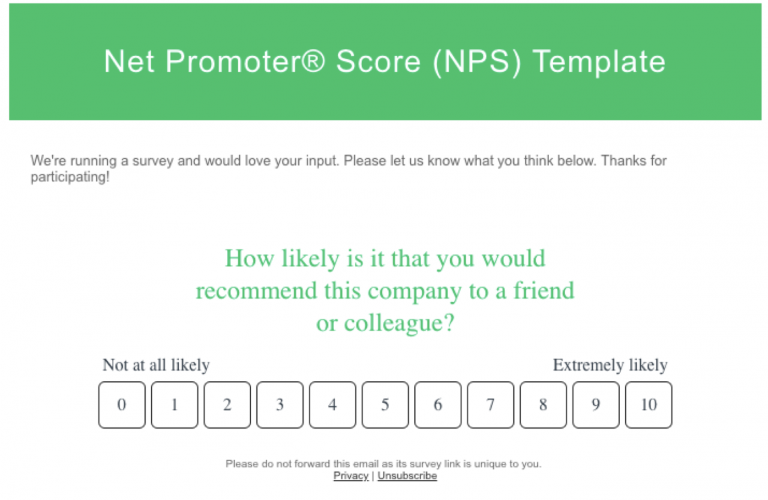
Another way to gauge patient satisfaction is through the use of the net promoter score (NPS). With NPS surveys, you ask one simple question: “What is the likelihood that you would recommend a company to a friend or colleague?” It’s a straightforward way of summarizing patient experiences and satisfaction that tells you if patients are loyal enough to refer your medical practice to others. Instead of asking patients a slew of questions that can be difficult to answer (and thus they don’t), you ask them this one question. You’ll receive more responses and can use NPS as a barometer to assess overall patient satisfaction.
Let’s take a look at two more interesting ways to measure patient satisfaction that sometimes go overlooked. As you structure your surveys, make sure to leave space for an open-ended response from patients. These open-ended responses can provide valuable feedback in the customer’s own words. Reading how customers frame problems or questions can be invaluable to marketers who are looking to refine their website or ad messaging. Patient responses can also be aggregated and subject to sentiment analysis to identify where negative feedback seems to congregate.
The other area to pay attention to is your mobile app. Increasingly, healthcare organizations are using apps as all-in-one patient portals, a secure place to send messages, check results, and view upcoming appointments. Pay attention to app ratings! If possible, make it easy for patients to leave ratings and feedback about their mobile app experience. This can help inform improvements to your app and fine-tune the patient experience.
6. Paid Advertising Metrics
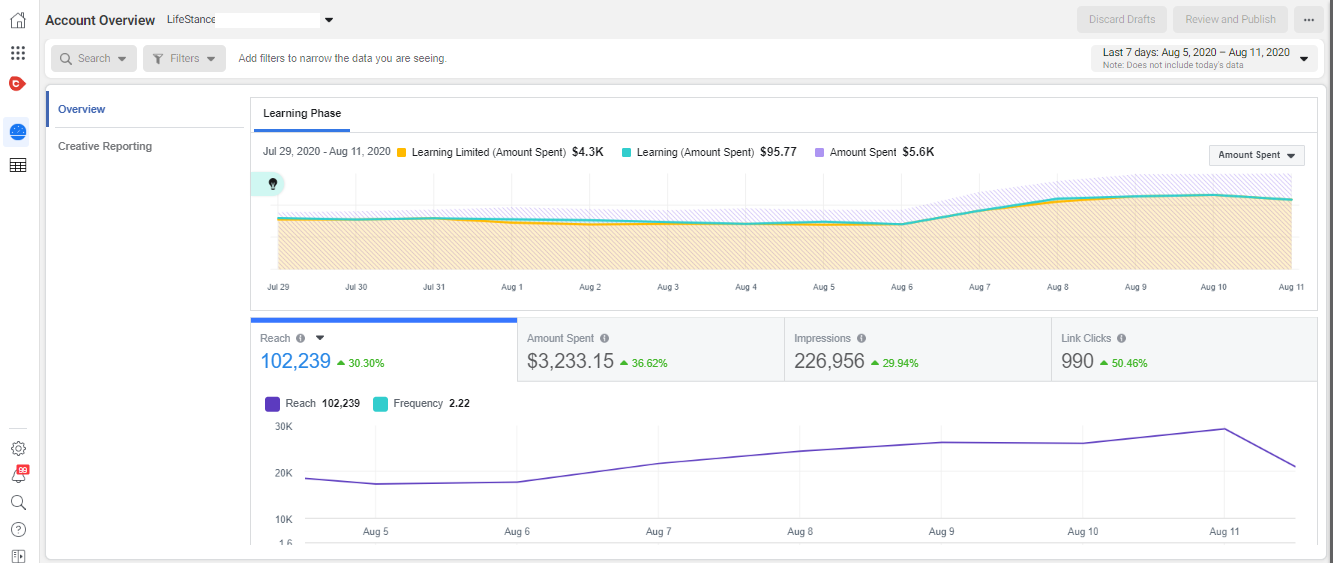
There’s so much you can do with paid advertising, from pay-per-click (PPC) to display ads to social media. While the strategies and tactics will vary from channel to channel, the metrics are generally consistent across the board. As a baseline, you’ll be looking at:
- Clicks: A flat value that indicates how many users clicked on your ad.
- Click-through rate (CTR): An indicator of how many people click vs. how many times an ad is displayed or seen (clicks/impressions x 100).
- Cost-per-click (CPC): What it will cost you every time a user clicks your ad. Also indicates the competition for a given keyword, target audience, etc. Very useful for managing ad spend.
- Cost-per-conversion (CPC): Calculated for a certain time period by dividing the cost of your ad campaign by the number of conversions.
- Conversion rate (CVR): Think completion here. CVR measures the rate at which users who interact with your ads make it to the finish line (purchase, sign up, etc.).
On their own, paid advertising metrics can give you an idea of overall performance for specific campaigns. Which ads are converting best? Which ads aren’t converting at all? You might discover that high-converting ads are also your most costly, or that a certain ad has a high CTR but not a lot of conversions. These insights can help guide changes and optimizations based on hard data.
7. SEO Metrics
I can’t tell you how many times a healthcare client is surprised to find out what their top ten organic landing pages are or the organic search terms driving the most traffic to their website. At their core, SEO metrics are a sort of search engine healthscore—indicators of how your web entities are being crawled, ranked, and found on Google.
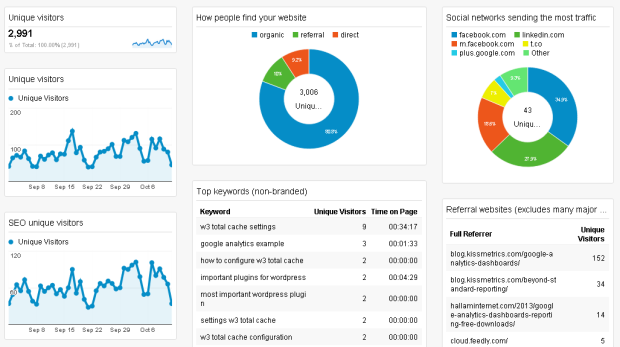
Typically, we like to focus on four fundamental SEO metrics, as follows:
- Organic traffic by search query: The search queries or keywords that are driving the most traffic to your website, often broken down into the top ten or twenty, or by target keywords.
- Conversions from organic search traffic: How many times an organic site visitor completes a goal (download, purchase, schedules an appointment, etc.).
- Organic revenue: How much cash can be attributed to users whose last click was one of your organic search results? Useful in understanding how much of your revenue can be attributed to organic search traffic.
- Branded vs. non-branded keyword traffic: Organic keywords containing your brand name or product name vs. brand-agnostic search terms. Useful in understanding branded traffic you are or should be capturing, or non-branded keywords that you are or would like to be ranking for.
Here are two of my favorite (and common) insights from SEO metrics. Healthcare brands will often find that they do not have a landing page optimized for the keyword driving the most traffic to their website. This can be an opportunity to capitalize on that organic traffic and increase conversions. Other times, brands will find that there is a high volume of location-based search terms for their brand that they ought to be tapping into with location-specific content and offers.
8. Lead source attribution
As with any business, digital leads are essential to most healthcare brands’ patient acquisition strategies. As such, there are often many different teams, campaigns, and activities aimed at driving lead gen, which makes measuring, reporting on, and attributing performance particularly challenging.
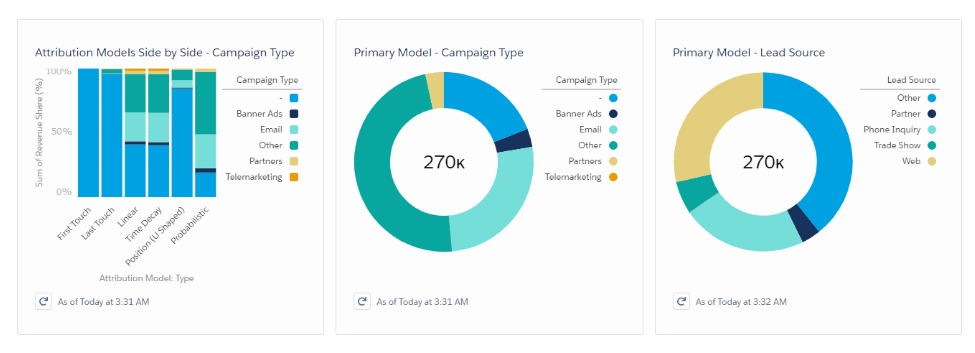
Lead source attribution shows how leads are being generated and where, the journey that leads take to conversion, and the overall value of a given marketing activity. Usually, these lead sources are defined and tracked within your CRM and can include phone, email, social media, organic search, and paid advertising campaigns.
There are a couple of lead attribution models common to healthcare marketing:
- First-touch: Based on the first channel or campaign a lead engaged with.
- Last-touch: Based on the last channel, campaign, or content a lead engaged with.
- Multi-source: Gives credit for leads and conversions based on the multiple channels or campaigns that a lead “touched” on the way to a goal completion.
Many healthcare patient journeys are multi-touch, meaning a patient lead might encounter a social media ad, website page, offer for a healthy living guide, and then show up for an appointment weeks later after having received and engaged with the guide’s follow-up email campaign. It can be very non-linear and create challenges when trying to understand where leads come from. Our own healthcare clients have found particular success with simplified, well-defined multi-source attribution models.
How to Align Marketing Metrics with Broader Goals
Any list of core healthcare marketing metrics ought to come with a stated caveat, and ours is no different: as useful as these metrics are, there is no one-size-fits-all approach. The key is examining your particular goals and identifying metrics that will tell you if you’re succeeding or not. SEO, for example, might not be part of your strategy. PRR might be a far less useful metric given the “one-time” nature of your customer journeys. The key is to align the metrics you do focus on with business-critical goals and broader financial KPIs.
This alignment should happen yearly, as your business objectives will likely change. You may also find that you’re unable to answer specific questions from the C-suite. Keep track of specific queries or instances when you wish you had insight into the effectiveness of a marketing tactic or campaign. On the flip side, don’t track metrics just to track them. They should provide value to your organization and help you make smarter marketing decisions. Reviewing and determining your marketing metrics and KPIs should be an essential component of your yearly marketing strategy sessions.
Ideas for Effectively Sharing Metrics with Your Healthcare Organizations
Visibility is important when it comes to marketing metrics. Today, shared, cloud-based dashboards make it rather simple to aggregate metrics from multiple sources, then create custom views and reports. We recommend investing time and resources into easy-to-share reports that can be read and understood by anyone, in any department, on the fly, and on any device.
As metrics are so often used to “make the case to stakeholders,” or to get buy-in for new initiatives, it’s important to present marketing metrics in language that your executive team can understand. Avoid jargon, for one, and perhaps omit more “operational” metrics and focusing on big picture trends (SEO performance and granular paid advertising metrics).
Our AI-powered healthcare marketing software, Patient Stream, can help you identify the marketing campaigns that are driving growth at your medical practice. It integrates directly with your EMR or EHR system and analyzes campaign performance in relation to patient acquisition and revenue objectives. Start making smarter marketing decisions when you have radical transparency into campaign performance.
Contact us to get a hands-on demo of Patient Stream and learn how you can get more leads while spending less.