




Prove that marketing is working. That’s the mandate handed down from every C-suite and PE board overseeing a multi-location healthcare group, and it rarely comes with much patience for a platform dashboard or a campaign win that doesn’t show up in the business’s own numbers.
No single number can carry the weight of that mandate, whichever one marketing chooses to lead with.
Patient volume is usually the number marketing gets held to, since it looks like the most direct measure of success. Hit the volume goal, and the assumption is that marketing did its job. But volume alone can hide a lot: new patients landing in a service line with thin margins, a cost per booking that’s quietly climbed past what the return can support, a location already at provider capacity. The number goes up, and leadership still isn’t convinced marketing understands the business.
In-platform metrics create a different version of the same problem. A strong CPA in Google Ads or a high conversion count in Meta looks like proof of performance. But that number comes from a system built to claim credit, with no responsibility to reconcile itself against what the business actually experienced.
Both problems trace back to the same root: measuring marketing’s impact through a single signal, in isolation, then hoping it holds up once finance or operations checks it against reality. It rarely does on its own. What holds up is triangulating across signals that don’t share the same blind spots, so marketing can speak the language the C-suite already speaks: financial impact, growth, and where the next dollar should go.
Attribution is the natural place to start, since it updates fast and is easy to lean on harder than it can support. It isn’t always the most reliable signal, though, and a handful of factors explain why.
Why attribution is complicated
Attribution is complicated by many factors, including:
- Patient journeys span multiple sessions across multiple platforms
- Patient journeys can run for weeks or even months, beyond most attribution windows
- Many conversions happen offline (calls, walk-ins, referrals, etc.)
- HIPAA regulations limit cookie-based tracking and audience matching
- Privacy regulations create structural attribution gaps
And if all of these challenges weren’t enough, there are two big traps which frequently trick marketers into building their strategy around numbers that misrepresent reality.
The two traps that mislead marketers
1) The blended CPA trap
Blended CPA is total spend divided by total conversions, viewed in aggregate month over month. It’s the single most obvious number to look at when evaluating your overall marketing performance. It’s also the number most likely to fool you into spending too much on acquisition by obscuring the marginal cost.
When your blended CPA number looks good, you want to throw more money at that platform. If your goal is $400 CPA, and your blended CPA is $300, maybe you increase spend. If your new blended CPA is $350, you might think it’s healthy because it’s still under target. But if you got there by spending $10,000 to book 10 new patients, the marginal CPA on that new spend was $1,000.
“It’s easy to feel great about your cost per acquisition and keep pushing budget in, when in reality, you could be losing money on each incremental patient you add.”
– Alex Kemp, Senior Director of Analytics, Cardinal Digital Marketing
Because Blended CPA is an average, it can easily drown out the fact that your additional budget would be much better off in another channel. Measuring increases in spend and new patients will let you calculate an incremental lift that more accurately reflects the value of your additional spend.
Even if your blended CPA on Google is far better than on Meta, it might turn out that the marginal efficiency of adding $10k more to the budget might be better on Meta than Google. Blended CPA will only tell you average cost. What you want to know is marginal CPA for your next investment.
QUICK TIP: Keep an eye on your impression share lost to budget in Google Ads. As long as that number is above zero, Google is telling you that more budget can still get you that efficient CPA. Once impression share lost to budget hits zero, that’s a sign that you need to look closely at marginal costs. (If you’re still seeing impression share lost to rank, you can usually improve that with quality scores and keyword relevance, but impression share lost to budget is the biggest sign of opportunity for more efficient marginal spend.)
2) The platform overstatement trap
Google, Meta, programmatic DSPs—they all want credit for every conversion. But it can be dangerous to take their word for it. View-through conversions allow a platform to claim credit when someone saw an ad, never clicked on it, and then converted days later somewhere else. They’ll still claim it as a conversion.
The result of all this is that adding up the conversions reported by three platforms will usually give you a total that vastly exceeds the actual number of new patients the business tracked. And it’s not a tracking problem you can easily fix, because the problem is systemic: platform reporting will always involve multiple platforms claiming credit for the same conversion.
“Every ad platform has an incentive to take as much credit as it can for a conversion. That’s just how the system is built.”
– Alex Kemp
If your patient saw a DSP ad, paused their scroll while a 15-second video was on Meta, and then, three days later, searched on Google to convert, all three platforms will claim credit for that conversion.
You can mitigate this somewhat by tightening attribution windows. We usually run a one-day view-through and a seven-day click-through by default, but for a long multi-touch journey, you might use a larger window. That shorter window will help reduce overlapping credit, but it won’t eliminate it.
Unfortunately, platform reporting can never be fully trusted. That’s just the nature of the beast. For healthcare marketers who need confidence in their numbers, the answer is never to rely on a single source, but to find agreement between multiple signals.
Learn more: Why good measurement starts outside the platform.
The Triangulation Framework
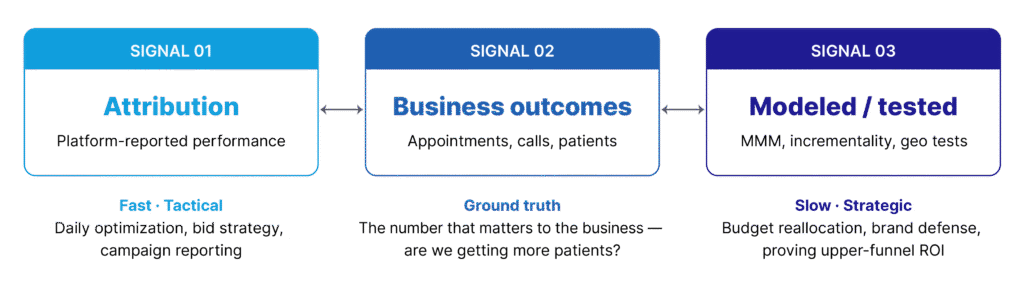
Rather than relying on platform-reported data alone, you can get a more comprehensive view by drawing on three types of signals at once:
1) Attribution
Attribution is all the platform-reported performance data, from Google Ads CPA and Meta conversion volume to call-tracking attribution and offline conversion uploads matched to click IDs. This data moves fast, and it’s a great source for daily bid changes and tactical decisions like budget pacing and creative tests within the platform. But for reasons we’ve discussed, it’s not reliable on its own for big strategic calls like brand spend or channel reallocation.
2) Business outcomes
Business outcomes are the on-the-ground numbers the business is most concerned with. This includes:
- Appointment volume, lead quality, and conversion rates from CRM/scheduling
- Inbound call volume by source and campaign from call tracking
- Revenue, patient LTV, and no-show rates from finance/operations
Unlike inflated platform-reported attribution numbers, these numbers are more reliable because they reflect your actual revenue and new patients coming through the door. This is also where the blind spot from patient volume gets caught: a rising number of new patients won’t tell you whether they landed in a thin-margin service line or whether the cost per booking has crept past what the return can support. Revenue and patient LTV will.
The caveat is that most CRM setups default to crediting whichever channel got the last click or touch before conversion, which can undercount the influence of upper-funnel channels like Meta, CTV, or programmatic that assisted the journey without being the final touchpoint. Multi-touch attribution can close some of that gap, but few organizations have it fully built out.
3) Modeled or tested
Modeled measurement uses statistical analysis to estimate the effectiveness of various marketing investments. Instead of trying to track every conversion individually (which is often impossible anyway), Media Mix Modeling can correlate overall marketing investment with business results over time, enabling probabilistic estimates of relative contributions.
Likewise, incrementality and geo holdout testing run controlled experiments to show causal lift without needing to track everything at an individual level. Pausing a channel in some markets while keeping it live in others gives you a better understanding of the incremental lift that channel is responsible for.
Unlike platform attribution, modeled measurement is platform-independent. So you don’t have to take Google or Meta’s word for everything. You use statistics and controlled experiments to estimate what effect marketing caused based on your own data.
But you do need a lot of data available to establish a baseline. It requires meaningful spend history (usually 12-24 months) and sufficient data volume to provide a solid basis for modeling or incremental comparisons. And it also takes more time and more analytical expertise to tease out those results, as opposed to just getting daily updates of platform attribution.
How the three signals work together
Each of the three types of signals has its advantages and disadvantages. But together, they can give you a very accurate picture of your marketing. If the signals are all aligned, you can be fully confident in what they’re telling you. Even just looking at Attribution and Business Outcomes, if those two signals are aligned, you can trust the story they’re telling you.
And when Attribution and Business Outcomes *aren’t* aligned? That conflict is an essential insight into your marketing, which should spur you to investigate further.
Conflicting signals worth investigating
Strong attribution, weak business outcome
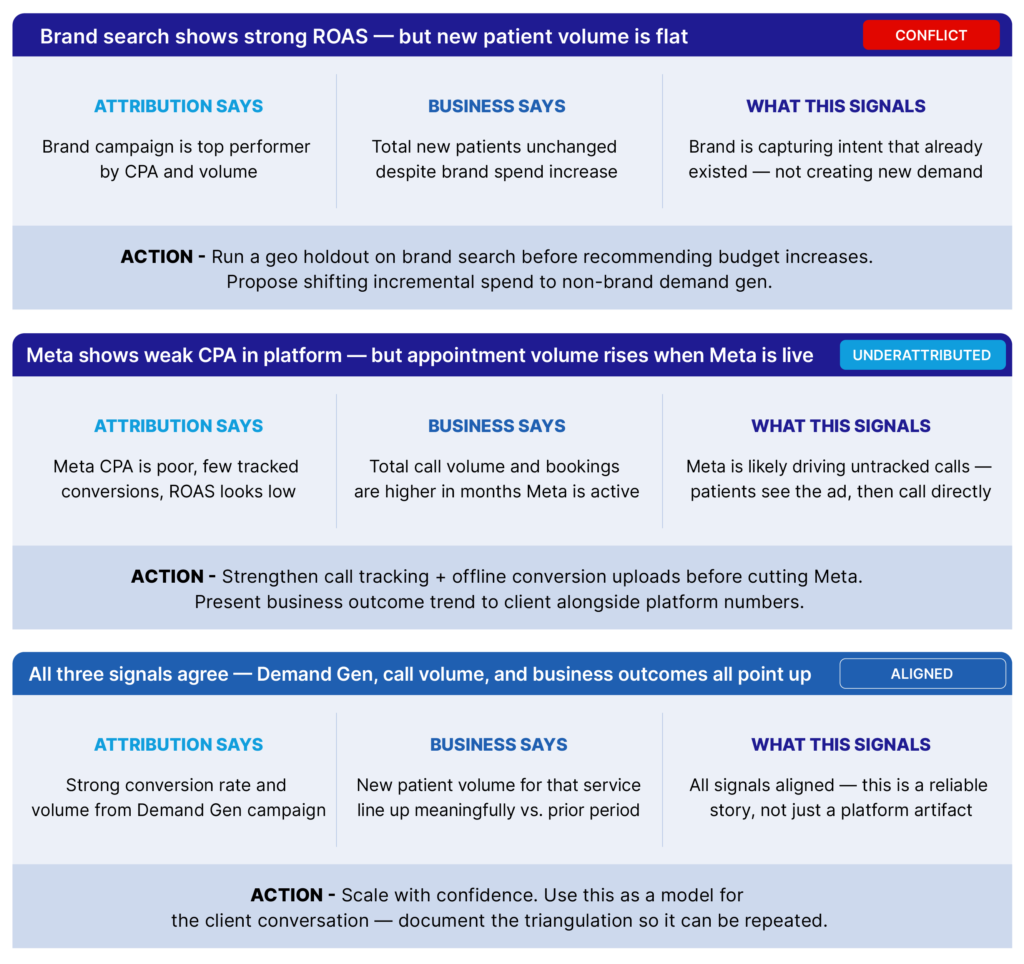
You’re running a brand search that shows strong ROAS, but patient volume remains flat. Attribution insists your brand campaign is the top performer by CPA and volume… but business outcomes show no new patients coming in the door.
Those signals mean your brand marketing could be cannibalizing existing demand rather than creating new demand. The best way to find out is to test: Run a geo holdout test on brand search and see whether it’s actually driving any new patient volume. Then test shifting that incremental spend to non-brand demand gen instead, and see how that performs.
Weak attribution, strong business outcome
Your attribution for Meta shows a high CPA with very few tracked conversions. But when you look at the business numbers, call volume and new booked appointments are always higher in the months where you’re allocating more budget to Meta.
Those signals suggest that the channel may be driving calls that aren’t being tracked as conversions, because patients see the ad and then call in directly rather than clicking. This is a sign that stronger call tracking and offline conversion capture are needed. Rather than cutting the channel as soon as you see a high attributed CPA, reconcile the business outcomes by improving your tracking to ensure the CPA is accurate.
Harmonious agreement
Of course, the best-case scenario is full agreement between all of your signals. When attribution shows a strong conversion rate and is backed up by business outcomes showing increased patient volume, you can be confident that your marketing is effective and you can scale that channel. (And don’t forget to document how the signals lined up, so you can repeat the read on future campaigns.)
How to actually triangulate your data
Data triangulation is, appropriately, a three-step process:
1) Connect your offline conversions. Your attribution setup needs to include offline conversions like calls and CRM-tracked appointments. (Getting your platform data to reflect real outcomes instead of just clicks and form fills isn’t easy, but this should help: The healthcare marketer’s guide to conversion signal optimization )
2) Pick one channel and run a real test. Run a geo holdout or lift study to assess the channel’s real impact before you make a major budget call.
3) Layer in modeled measurement as spend history and data volume grow. This will let you validate and calibrate what attribution and testing are already showing.
Do keep in mind that all of this is on a maturity curve, not just a one-time fix, so don’t feel like you’re failing if your marketing team doesn’t have all three signals fully built on day one. All you need is a clear sense of what you’re missing so you can continue advancing along the maturity curve. And here’s a case study of an org doing exactly that: Building a privacy-safe engine for patient growth
Good things come in threes
No single number, however reasonable it seems to lead with, can carry the full weight of proving marketing’s impact. Patient volume, attribution, even a single quarter’s revenue trend: every one of them has its own blind spot. The confidence the C-suite and PE board are actually asking for comes from triangulating across signals that don’t share the same weaknesses, so the story holds up from every angle.
Building that maturity, or even just building toward it, is a massive competitive advantage for multi-location healthcare brands. It’s what lets marketing speak the same language as finance and the board: financial impact, growth, and where the next dollar should go.
