

The truth is, you may have a stunning website, but if you don’t know where your customers or visitors are coming from, what parts of your blog they find most helpful, how long they spend on each page, and how often they are coming back, you’re seriously missing it.
And that’s the beauty of Google Analytics. According to W3Techs, Google Analytics is the most popular website analysis solution with 53.3% of websites from around the world using it to track performance.
Similarly, Trends recently stated that about 30,387,747 live websites are currently using Google Analytics. With these stats, you will agree with me that this tool is incredibly fantastic.
This is the reason why serious business owners use this sleek tool. Google Analytics is super easy to implement and offers valuable information that can help enhance your bottom line.
Although Google Analytics has some limitations, it’s still a powerful tool for marketers. The fact that (like many other Google tools) it’s entirely a free program makes it even more amazing.
In this post, I will be sharing with you the 10 most important Google Analytics metrics and terms you should start paying attention to from today.
NB: I’m assuming you’ve already set up Google Analytics for at least one of your sites. However, if you haven’t, you can find a step-by-step walk-through of the entire setup process in the Google Analytics Help Center.
So let’s discuss core Google Analytics metrics and how you can use the insights to boost your search visibility quickly.
1. Traffic Sources
This is one of the most critical parts of your Google Analytics account. Where your website visitors are coming from tells you a lot about the strength of your marketing campaigns, and equally, shows you where your weaknesses are.
Every website has three primary sources of traffic which include referral, organic, and direct.
Referral traffic tells you which websites are sending you traffic. The traffic may be from a banner ad, a link, social media, or an affiliate portal.
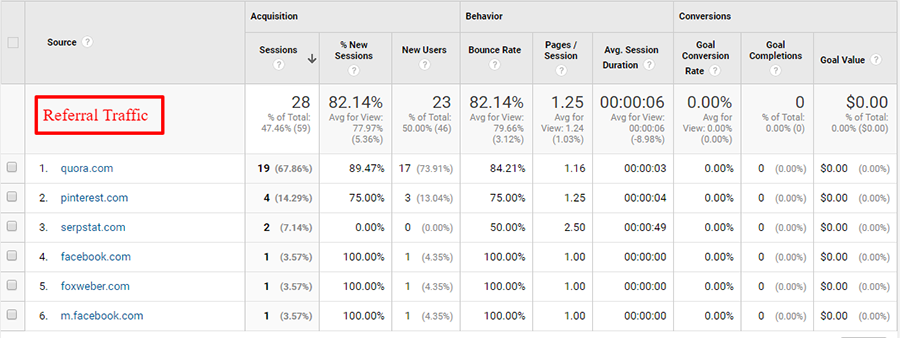
The “all traffic reports” will break down your visitors by the website they came from and for each website give you:
- Pages per visit
- Number of visits
- Average time on site
- Bounce rate
- Percentage of new visits
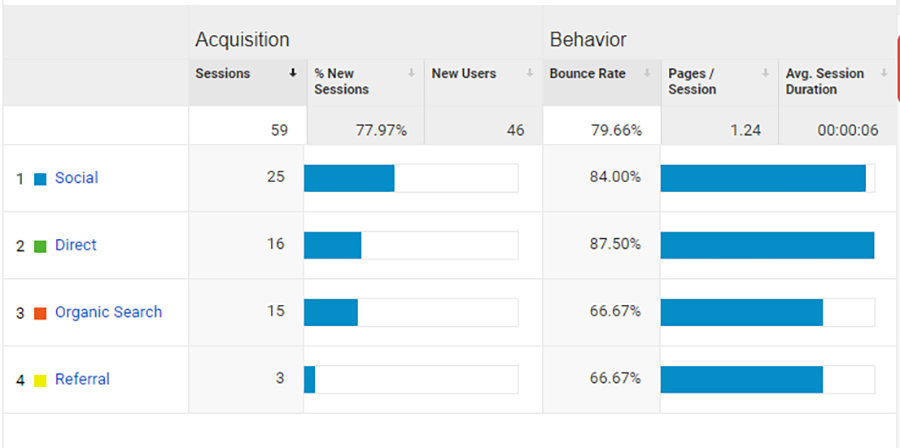
Search Engines traffic talks about pay-per-click or organic traffic coming from the entire search engines on the internet. And finally, direct traffic shows visits from bookmarks, traffic which has lost its referral over time, and URLs typed directly into the browser’s address bar.
Typically, you want to have different sources of traffic so that your traffic isn’t tied to a single source that’s far beyond your control. For instance, if 85% of your traffic comes from Google organic results and Google suddenly changes their algorithm as usual, and your website is affected thereby knocking you off the first page, you’ll certainly see a massive drop in traffic.
On the other hand, if only a small percentage (maybe 30 or 40%) of your traffic is coming from a single source (like the organic search result we mentioned earlier), it’s easier to manage because if something goes wrong, it won’t affect you as much because you will still be getting good traffic from other sources.
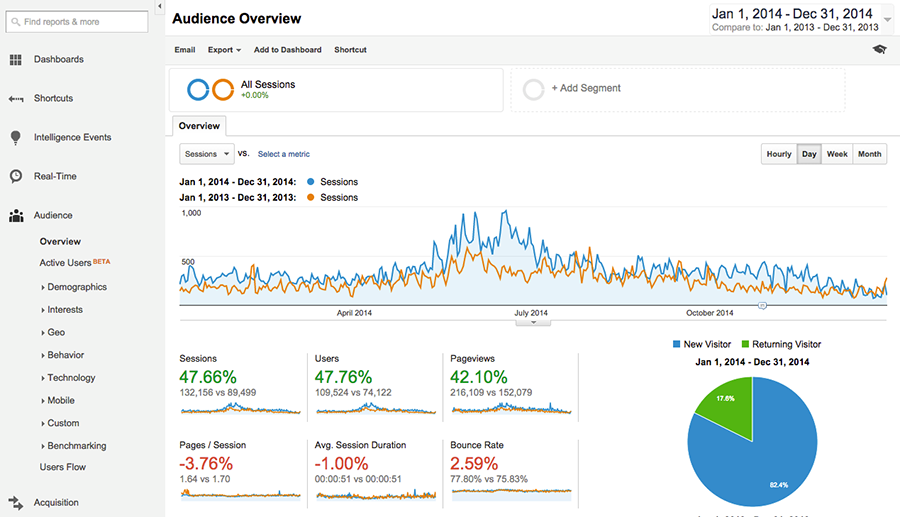
2. Average Session Duration
Average Session Duration contributes largely to the user engagement story by demonstrating how long users stay on your web page.
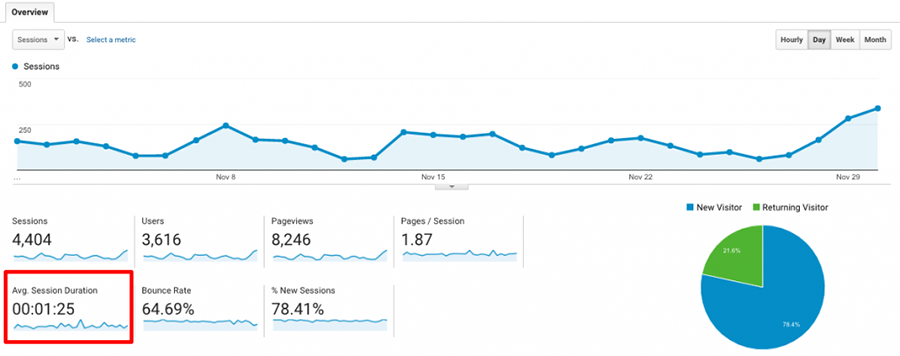
At the website level, it’s a useful metric that indicates engagement which is the actual value of your website content.
What should your average time on a website be?
The industry standard for a website’s average session duration to be considered good is 2 to 3 minutes.
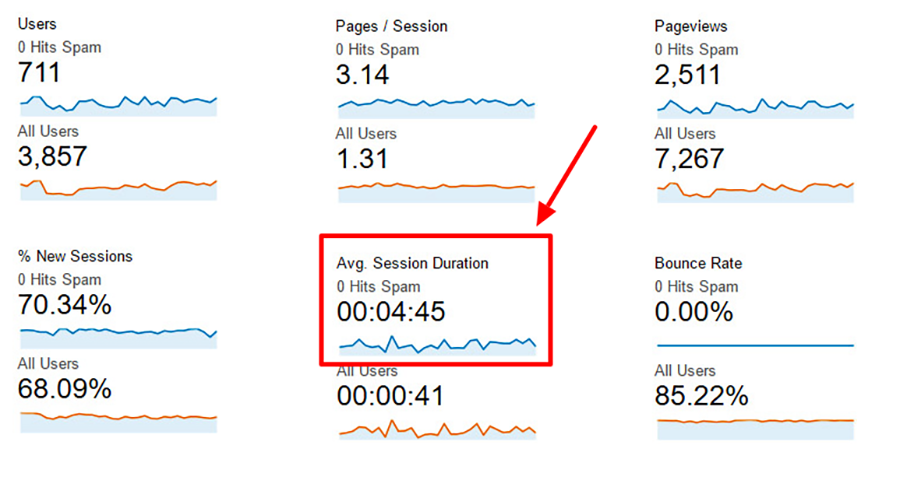
Two minutes may seem short, but it’s enough time for website users to read content and interact with your site. Longer sessions mean more engaged visits.
Time is your most precious asset as a human being, and this number helps you understand how much time your readers are willing to sacrifice for your content.
Google uses session duration as a ranking signal with longer times meaning that you have higher quality content. Hence, Google will most likely reward you with a higher ranking in the SERPs.
However, since this number is an average-based metric, you must be very careful at trusting it without further context. This metric is best when looking at traffic sources, segmented views, and considering other engagement metrics.
3. Percent of New sessions
This simply represents an average percent of first-time users to your website.
This is a useful metric that indicates how many of your blog visitors are coming for the first-time or are returning visitors. It shows the ability of digital marketing efforts to attracting new visitors.
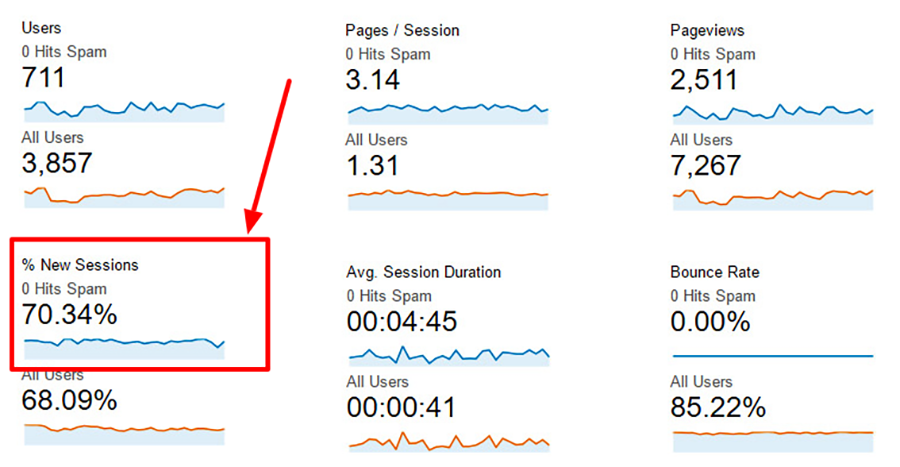
It’s an important key performance indicator (KPI) for determining the ‘stickiness’ of your website, or in deciding whether your blog is worthy of multiple visits from users or not.
What percentage is perfect for new sessions?
There’s no benchmark here. I generally see a range of 40 – 80%.
Websites will vary in their mix of returning and new visitors, and this mix will differ depending on your niche, business, and goals.
If one of your goals is to generate leads, then you’ll want a high percentage of returning visits because it often takes multiple visits and interactions with your website for readers to convert and take your desired actions.
Don’t be too focused on attracting new visitors that you abandon your existing audience. You’ll find that not ALL website visitors are worth keeping – some will just be a total waste of your time and resources.
You should look at your new sessions broken down by page. Some pages will target new visitors to your site, whereas other “deal closing” pages will focus on returning visitors. Remember that your website is a sales funnel and different pages serve different purposes in that funnel.
4. Event Tracking
In Google Analytics, an event is a user action which can be measured. This event could be:
- Podcast downloads
- Video downloads
- Page view
- Button click
- Form submission
- External link
- Light box
- Etc
Goals within Google Analytics let you monitor actions on your website and tie them into goal completions.
![]()
To setup goal tracking for specific events, see the Create, edit and share goals from Google Analytics Help.
Using event tracking can help you increase your goals, as it will let you know which elements are working for your website visitors, and which aren’t.
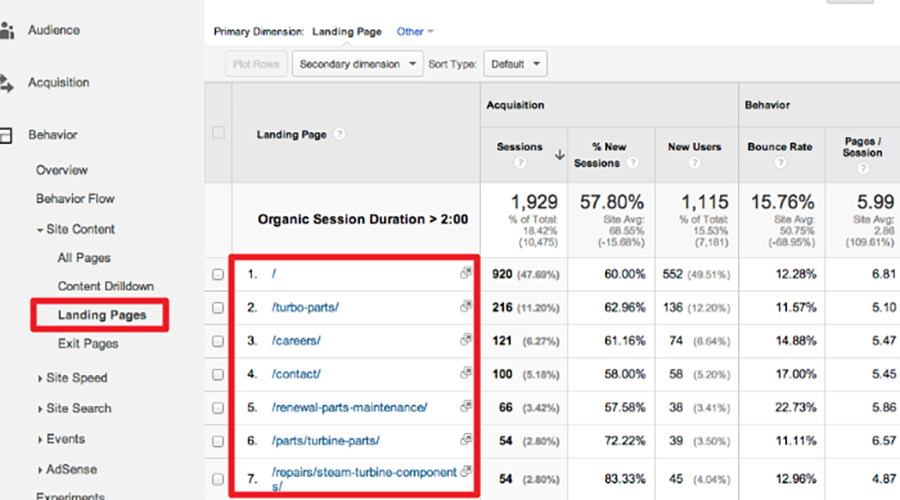
5. Landing Pages
Landing pages shows you the first page of your site that visitors land on.
If a particular page generates most of your traffic, it’s either ranking highly on search engine results or attracting a lot of shares on social media. If this page is generating useful traffic (those completing your goals), then you should generate additional similar content.
Landing pages can also be used to track ad campaigns. If you put an ad in a newsletter, you can use a unique landing page to monitor how many people clicked on the link within the newsletter to visit your web page.
Knowing which pages are generating the most visits is very helpful when calculating effective online marketing performance. You can use the landing pages to gain a better understanding of which pages on your site perform well, and via which marketing methods.
Landing pages also show you conversion rates broken down by page. You’ll see the most popular landing pages on your website, arranged by the number of visitors that have landed on each page over the specified period. It’ll look like this:
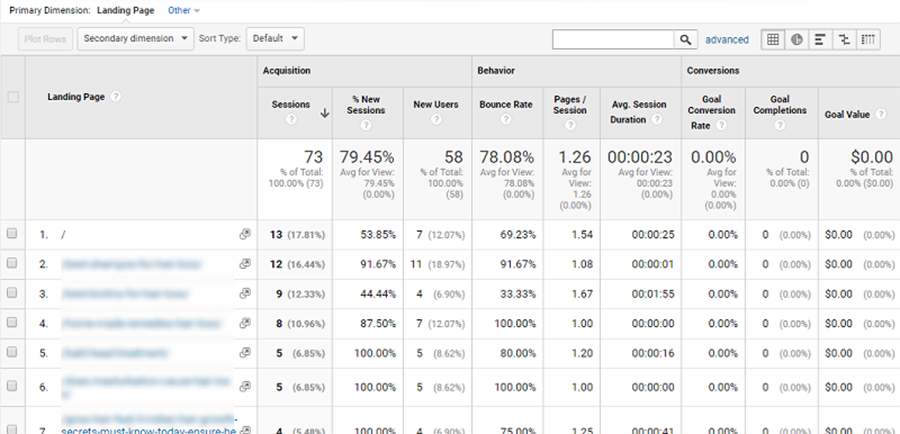
It’s important to review different landing pages’ conversion rates and the sources of traffic that resulted in those visits and conversions.
Finding the right combination of landing pages and digital marketing methods can have a significant impact on conversion rates and increasing your ROI.
6. Exit Pages
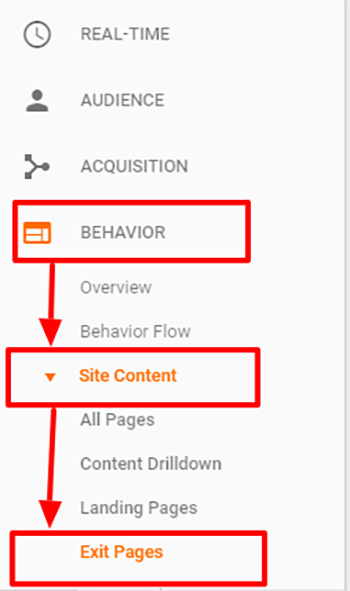
An exit page is seen as the opposite of a landing page, and it refers to the last page a website user viewed before they leave the site or their session ends. In Google Analytics, Exit page can be found via this path:
Content > Site Content > Exit Pages just under landing pages.
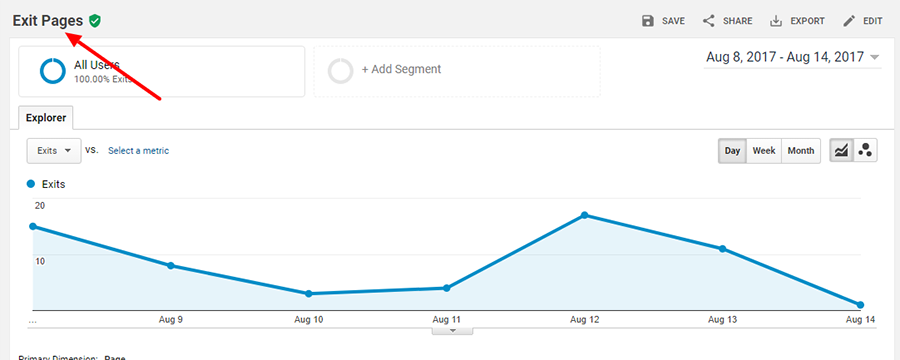
The Exit Pages feature of Google Analytics lets you see which pages on your site people often end their sessions on or depart from the site after viewing.
Unfortunately, most marketers confuse exit rate with bounce rate, but exit rate displays a site’s outflow. Where do users leave your site from after they start their session? This report should highlight and show which pages you should focus on to boost the chances of conversion.
Looking at this report, you will clearly notice that a lot of the high rate exit pages may have nothing to do with the conversion funnel. Users may come to your site for different reasons, and it’s critical to highlight these scenarios and their journeys.
It’s important to understand that most websites will have exit page rates of about 97% (mainly E-commerce websites). Many of these pages will be the ones you don’t want them to exit on. However, it’s hard to determine whether this is a sign of failure or success.
It’s necessary to understand the data and know what your users may be doing. An exit could be a result of a user reading a product review and then felt like buying it in the store, or takes the phone to call your company, or are they exiting your website because of poor usability issues. That’s what you need to figure out.
Finally, top Exit Page analysis is an ideal way to highlight areas you may need to focus more on, but it’s equally important to understand that other factors contribute to high site exit rate than just poor communication or usability.
When using the Exit Report, it’s crucial to know what roles each page may be playing in offsite and onsite conversion and factoring that into your overall marketing decisions.
7. Bounce Rate
Bounce rate is the percentage of single-page website visits.
In other words, if a user comes to your website and exits without going anywhere else on the site.
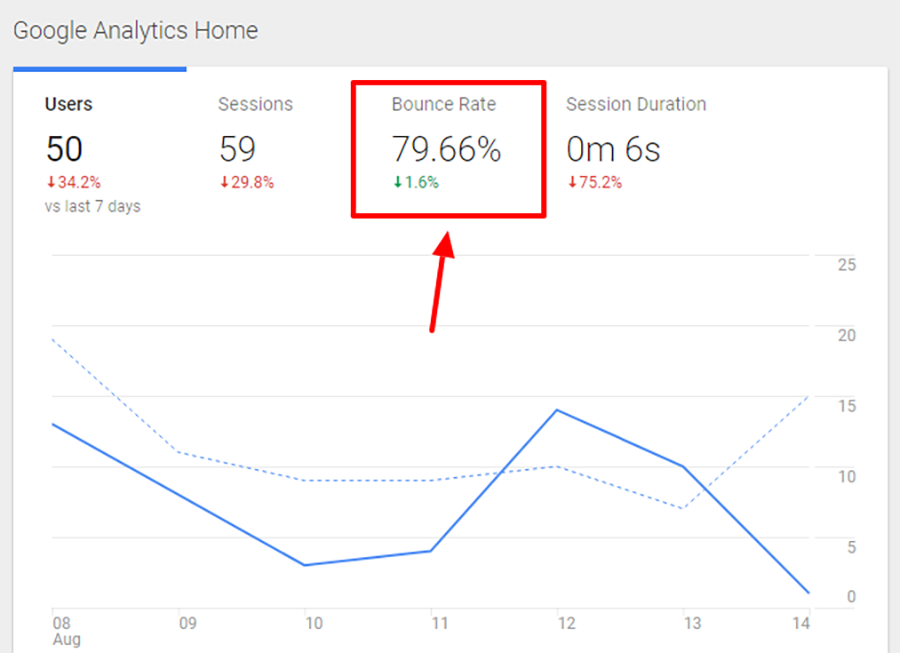
At the site level, bounce rate is helpful as a general sign of user engagement and the state of content value and quality. This metric helps to figure out when problems exist on your site.
However, bounce rate is totally dependent on the site. It must be used together with other engagement metrics such as Pages Per Visit and Average Session Duration.
What’s considered a good bounce rate?
Honestly, this will depend on several factors because there’s no hard and fast rule to it. 50% is an industry standard. However, this number should always be considered with other metrics and the nature of your business. I often see bounce rates ranging from 30% – 70% across different industries.
Higher bounce rates are typically common and expected on blog posts. Whereas gateway pages such as the home page you should strive for a much lower bounce rate.
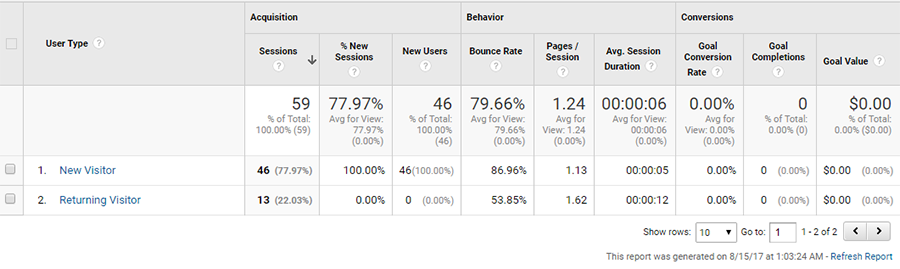
To see the difference in bounce rates between new and returning visitors, go to:
Behavior – New Versus Returning
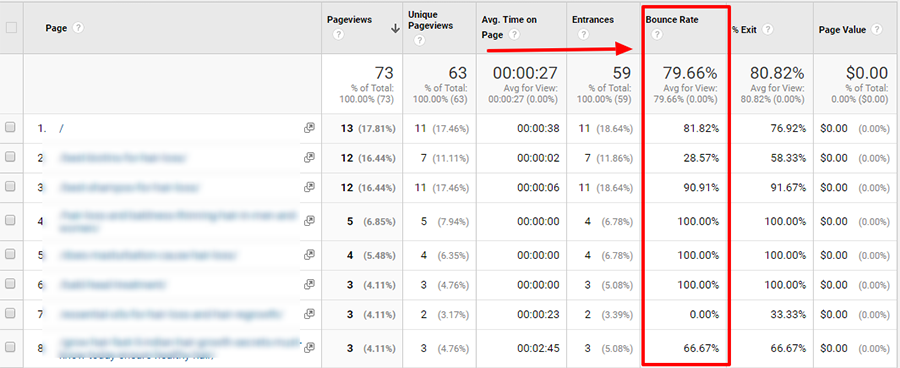
And to view bounce rates for individual pages go to:
Behavior > site content > all pages
Bounce rate is always unfairly flagged as a ‘bad’ metric, but it’s not inherently good or bad. It only indicates how often site visits stay on the same page from their first entry.
Standard bounce rate “in Google Analytics” does not have anything to do with time on site or how quickly a user exits the site —therefore, if you’re judging the success of your website on a high bounce rate, you’ll be missing valuable information about how users are actually interacting.
For example, consider a visitor that clicked on your site from a search engine result, spent few minutes reading a landing page, then completes an off-site call-to-action. In Google Analytics, that’s considered a bounce, even though it leads to an interaction.
Other factors can also contribute to high bounce rates. Anything from slow page loads, ease of navigation, irrelevant or low-quality content, poor aesthetics, etc.
Once you’ve identified there’s a problem, dig a little further to find out why your visitors are leaving, and then fix it. Visitor recording tools can be very beneficial in determining what is causing bounces.
8. Drill into specifics using “Advanced Segments.”
Advanced Segments lets you segment specific types of traffic within Google Analytics reporting. For instance, you can view your Google Analytics standard reporting data for only your US visitors if that’s what you want.
Here’s an overview of some of the ways to use Advanced Segments:
- See all of your Google Analytics (GA) custom and standard reports for users and visits that correspond with specific criteria
- Create custom segments with an “easy to use” interface that will help you through the five types of custom segments – Behavior, Demographics, Traffic Sources, Technology, and Date of First Visit.
- Add demographic data (gender, interests, and age) in your segmentation data
- Import custom segments created by the Google Analytics team with other Google Analytics users
- Use a custom link to share your custom segments with others
In other words, Google Analytics Advanced Segments lets you separate specific traffic types within the reporting view for a better understanding of user’s journeys.
For instance, you can view how your male traffic completes transactions and reviews content on your site compared to all other traffic.
Here’s a guide that will help you understand, create, and use Google Analytics Advanced Segments.
Advanced Segments can help you understand:
- Demographics: Does a particular age group show different purchasing patterns and content review on your site than another age group? How does that compare to the rest of your site traffic?
- Referral source type: Do social media referral visitors engage with more content because they’re coming from a (lifestyle content) state of mind before arriving on your website?
- Keywords: How do visitors who use a particular keyword to arrive at your site react differently from those who type other keywords? This is useful information when carrying out paid search campaign research.
- Regions: Do African customers buy more to meet up with the free shipping requirements for international consumers, or is their average order costs/quantities consistent with your US-based consumers?
- Revenue: How do your customers who spend over $1000 engage with the site compared to those who spend $100 or below?
- Page views: How does a particular segment of your visitors respond to a specific page on your site? Are they more likely to buy your products/services after seeing a custom landing page or reading a blog post?
- Devices: How do mobile users react to your site, and how does this differ from users on other devices? Are mobile users consuming more content, but purchasing less?
Finally, advanced segments can help you understand the various groups of website visitors that make up your entire audience. This will further help you to identify both your high-quality and weak audiences—and enhance your conversion and engagement optimization strategies.
9. Take caution with the “Intelligence Events”
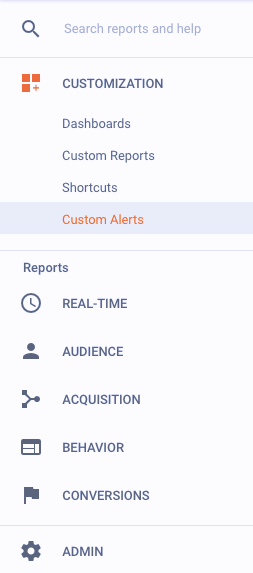 Google Analytics Intelligence Events can be used to create custom alerts.
You can create custom alerts for anything you want related to your website. Some common uses include:
- Sudden changes in your traffic
- Goal completions
- Specific page visits
- Changes in referral traffic
- Monitoring success of specific campaigns
Fortunately, creating alert is very simple: Just set up your alert conditions and choose whether you want to be getting an email notification whenever an alert is triggered, and that’s all.
You can set alerts for all traffic or traffic segments, and it can be set for things like changes in visit numbers (like I mentioned above), goals, or similar metrics.
Intelligence Events is an excellent tool for monitoring potential problems on your website or sudden spikes in conversions or traffic.
Getting fast, accurate information about all changes to your website means you can respond promptly to changes and ensure your customers and visitors are always happy.
10. Content Reports
The Pages Report and the Content Drilldown Report gather traffic details for your pages by directory and page respectively. In the Navigation Summary tab of the Pages report, you will see how visitors land on each page and where they headed afterward. The figures are interpreted as a percentage of total page visitors.
- Exits shows how often visitors exit the site from the page
- Entrances are page-views where users arrived via the page
- Previous Pages talk about users who visit the page from another page on the site
- Next Pages are page-views which are followed by a page-view of another page
In the Landing Pages report, you will see the pages in your site that visitors arrived at and their bounce rates.
If the bounce rates are high, you will have to tailor them more closely to their advertising and referral links.
Furthermore, the Entrance Paths tab monitors how your site visitors navigated from the landing page.
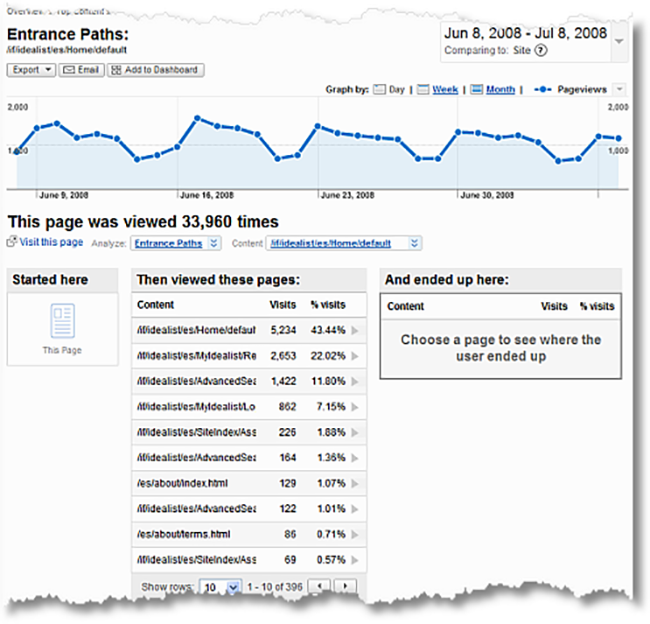
Click the link for a landing page in the left column, and you will see a complete list of all of the clicks on that page. Choose the purchase page link. The right column will contain pages your visitors proceeded to from the purchase page.
Conclusion
Online marketing experts are able to gain a tremendous amount of insight from analytics. Google Analytics can be a very useful tool for your business but you need to set it up correctly in order to benefit from it.
Remember that making quick and smart decisions are essential for a successful online business. And for that to happen, you need data which will give you the needed insights and nudge that you need to take that bold step.
I’d love to hear from you. Which of these Google Analytics metrics have you benefited from, and how?