




You’ve got a number you’re accountable for this year. More revenue, more locations pulling their weight, more patients in the door for the providers you just brought on board. And you know paid media has to be part of how you get there.
You can see the growth target. You can see the campaigns that are capped out, losing ground to competitors every day. What you can’t say, not with any real precision, is what closing that gap would actually cost you, or what it would return. That’s why the budget conversation stalls before it even starts.
We’ve run paid media for a multi-location healthcare group working under this exact kind of growth pressure for two years. Here’s what we’ve learned. The marketers who get their next budget increase approved can tell you exactly what a dollar of new spend returns. They know what it costs, and why they’re confident enough to put their name on it.
This is a case study in how we built exactly that for one of our clients: the measurement foundation and the forecasting model underneath it. Here’s how we did it.
Can paid media actually close your growth gap?
Most multi-location healthcare groups aren’t short on ambition. They know they need to grow into new markets. They know newly hired providers need a full schedule fast. They know competitors are getting more aggressive in the same zip codes.
What they don’t know is whether paid media, specifically, is strong enough a lever to close that gap, and at what spend level it starts to pay off.
If you’re chasing a growth number, the real question is whether this channel gets you there or whether you’re about to pour money into something that plateaus long before you hit your target.
Most marketing teams can’t answer that with real confidence because the data underlying their ambition isn’t clean enough to build a forecast.
Why most healthcare marketing teams can’t forecast their own growth
Ask most multi-location healthcare marketers what a bigger budget would buy them toward their growth number, and you’ll get a confident guess. Rarely will you get a number they’d stake their credibility on.
That’s a measurement gap hiding underneath a strategy question.
Too many groups count new patients twice: once from phone calls, once from online scheduling. Those two counts rarely agree. Add in canceled and rebooked appointments padding the online numbers, and you’ve got a booking total nobody fully trusts. Try to forecast what more ad spend gets you toward a growth target on top of a number like that, and what you get back looks like a plan. It’s really a guess wearing a plan’s clothes.
That was exactly the position our client was in two years ago. Real growth pressure. New markets are opening up. New providers who needed patients on the books fast. No way to say what unlocking more budget would actually cost, or deliver toward any of it.
Two years building the measurement foundation
When we took over the account in June 2024, spend had already drifted down to $47K a month, down from a $75-84K peak, even with 50+ active locations still generating demand and growth targets that weren’t slowing down. The strongest-performing locations were losing 37% of their available ad impressions because their campaigns hit daily budget caps before the day was over. Every one of those capped hours was a patient who searched, didn’t see the ad, and booked somewhere else, a patient this client needed toward its growth number and didn’t get.
Closing a growth gap on faith doesn’t work. Earning the right to forecast it does, and that took two moves.
We unified the conversion data first. By November 2024, call tracking and online scheduling activity fed into one clean, HIPAA-compliant new-patient-booking number. No more guessing which of two conflicting totals was closer to true, and no more building a growth plan on top of a number that might be off by 60%.
Then we scaled spend in deliberate, validated steps. Between May and October 2025, monthly spend grew gradually from $73K to $204K, with each increase generating real performance data rather than another assumption to build the next ask on.
This is the unglamorous groundwork that has to happen before you can determine what the next dollar of spend will actually buy.
Building a forecast model with four budget scenarios
By May 2026, we had ten-plus months of clean, unified booking data behind us. That’s when we built something most healthcare marketers never get handed: a model that could answer “will more spend get us to our growth number” at any spend level the client wanted to test.
The model laid out four scenarios:
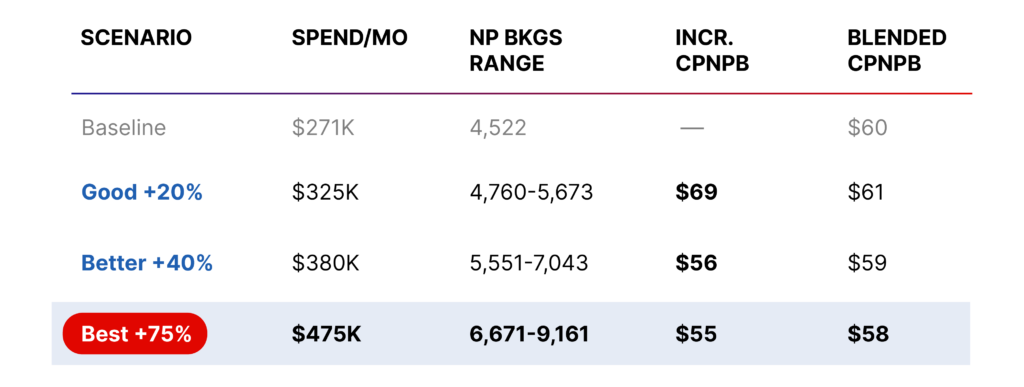
Every scenario, including the most aggressive one, produced an incremental cost per booking between $55 and $69. The client’s own approved ceiling was $75. Every scenario forecast cleared it, and each mapped directly to a specific patient volume the client could weigh against their own growth target.
The client approved $453K a month, 96% of the modeled best-case ceiling. When the growth math finally held up, they went after it, choosing near the top of the range.
The scale-up executed fast: $271K in April, $335K in May, $449K by June. A 67% budget increase, fully in market, within sixty days. When the ask is a number instead of a story, the internal debate about whether to grow mostly disappears. What’s left is deciding how fast.
The results after scaling budget 65%
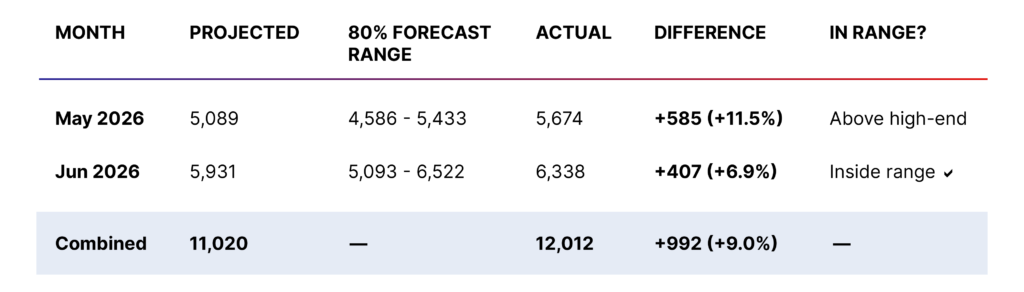
We checked the model against what actually happened. Using its original parameters, we projected what it would have called for each month, then compared that to real results.
May’s projection was 5,089 bookings, with an expected range of 4,586-5,433. Actual bookings came in at 5,674, beating even the high end by 11.5%. June’s projection was 5,931; the actual came in at 6,338, a 6.9% beat. Combined, actual bookings ran 9% ahead of the model’s projection.
A model that underpredicts is the safer kind of wrong to be. It meant there was more growth available than even the data-backed plan assumed, and it gave us a full year of higher-spend data the original model had never seen.
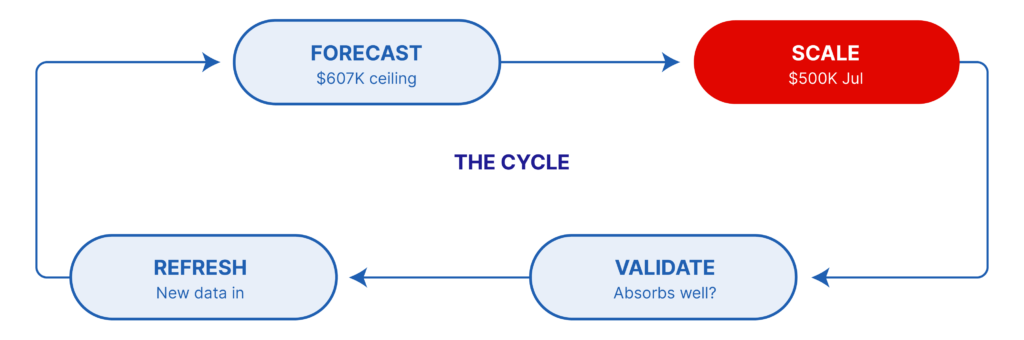
We used that data to refit the model. Forecast error dropped from 16% to 4.5%, a 72% improvement in accuracy. The updated model also produced a new ceiling: a refreshed “best case” of $607K a month, with roughly $23K a week of headroom still sitting in PMax before hitting its projected saturation point, meaning there’s still more growth on the table to go after.
How the forecast held up against actual results
The marketing team now has a standing answer to the question their own leadership keeps asking: what would more spend get us, and is it worth it.
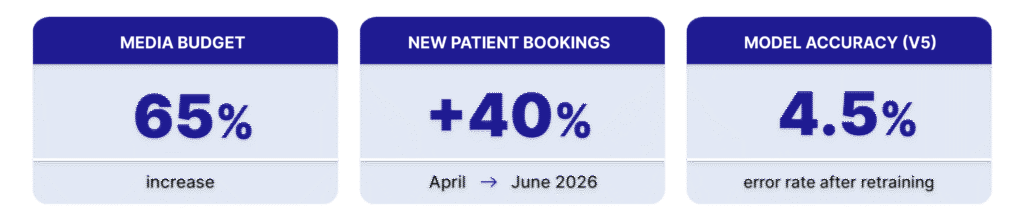
The full scoreboard: budget grew by 65%. New patient bookings grew 40% between April and June 2026, real progress against a real growth mandate. And after retraining on a full year of data, the model’s error rate sits at 4.5%.
Now, the question became how much more they needed to hit the number, and when to go get it. July’s target is $500K a month, a step toward that refreshed $607K ceiling, running the same cycle that got the account here: forecast, scale, validate, refresh.
What this means for your own growth number
This kind of forecasting doesn’t happen overnight. Before we could build a model like this, we spent two years fixing the underlying data: merging call and online bookings into a single number, removing duplicates and false positives, and putting the right tracking infrastructure in place. Then we gradually scaled spend over a year to generate enough validated data to actually train a model.
There’s no way around building a clean measurement foundation first. It takes real time and real infrastructure work.
That work is what makes the next part possible: telling your own leadership exactly what more spending will cost and what it will return, before you ask for it. Every multi-location healthcare marketing leader carrying a growth number, a set of capped campaigns, and unproven upside is looking at the same investment before they can build something like this.
The marketers who hit their growth number this year will be the ones who have already started that work.
